
Homelab Observability: Grafana + Prometheus + Loki
“If it isn’t observable, it’s a rumor.”
Today’s homelab sprint wasn’t about new apps. It was about confidence. I wanted a single place to answer: What’s healthy, what’s noisy, and what’s about to fail? So I built a full observability stack around Grafana + Prometheus + Loki and wired in node, container, log, and probe signals.
Note: This post does not expose internal IPs or Tailscale DNS names. Any references to hosts are intentionally generic.
✅ What I Shipped
Metrics pipeline
- Prometheus scrapes host and container metrics.
- Node Exporter feeds CPU, memory, disk, network, uptime.
- cAdvisor adds per-container metrics.
- Blackbox Exporter probes HTTP service health.
Logs pipeline
- Promtail ships container + system logs.
- Loki stores and indexes logs.
- Grafana overlays metrics + logs in one view.
Dashboards
- Homelab Overview (status, CPU/memory by node, top containers, errors)
- Services Overview (CPU, memory, disk, network, uptime, status per node/service)
- TrueNAS Netdata Overview (Netdata metrics)
- Router Overview (Wi-Fi + router stats)
- Jellyfin Overview (service health + host metrics)
🧭 Architecture (ASCII)
                   +--------------------+
                   |      Grafana       |
                   |  Dashboards + UX   |
                   +---------+----------+
                             |
                             | queries
          +------------------+------------------+
          |                                     |
  +-------+-------+                     +-------+-------+
  |  Prometheus   |                     |     Loki      |
  |  Metrics DB   |                     |   Logs DB     |
  +-------+-------+                     +-------+-------+
          |                                     |
  +-------+-------+                     +-------+-------+
  | Node Exporter |                     |   Promtail    |
  | Host Metrics  |                     | Log Shipper   |
  +-------+-------+                     +-------+-------+
          |
  +-------+-------+     +------------------------+
  |  cAdvisor     |     | Blackbox Exporter      |
  | Container CPU |     | HTTP/TCP Probes        |
  +---------------+     +------------------------+
In short: metrics flow into Prometheus, logs flow into Loki, and Grafana sits above both.
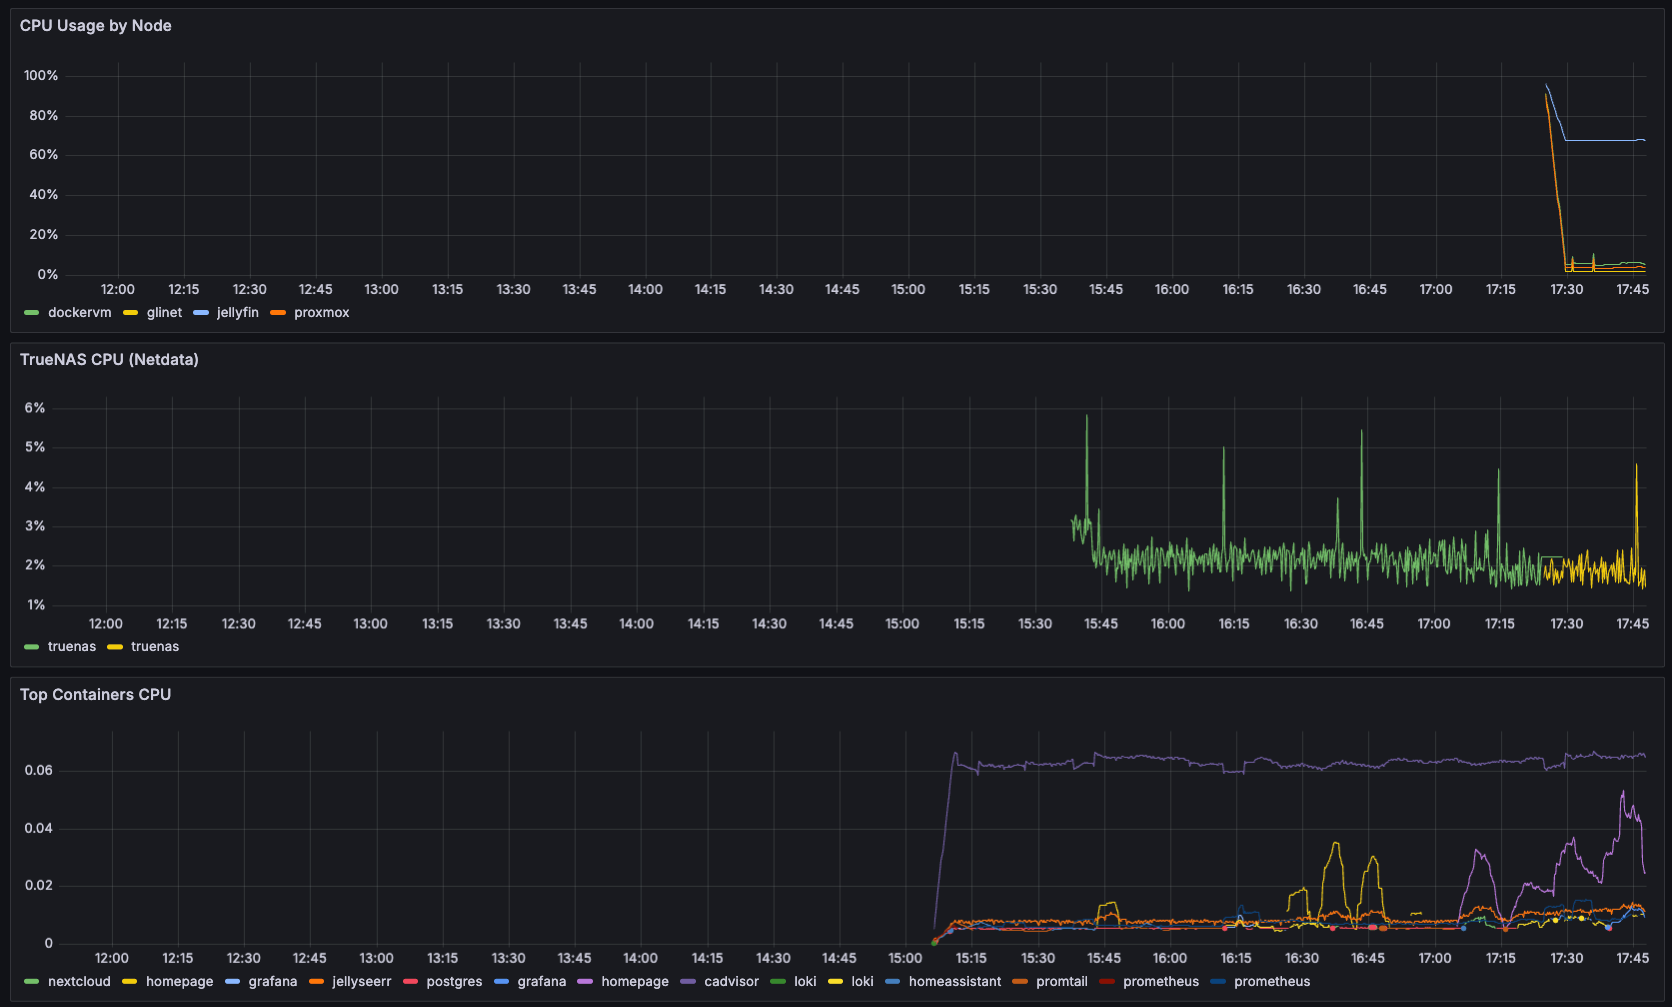
🖼️ Snapshot (Dashboard excerpt)
⚙️ Implementation Highlights
1) Service labels for readable graphs
I added service labels in Prometheus targets so dashboards show friendly names rather than raw URLs. That one change made every legend and table readable at a glance.
2) Netdata for TrueNAS
TrueNAS didn’t expose node-exporter easily, so I deployed Netdata and scraped its Prometheus output instead. It cleanly feeds CPU, RAM, disk, and network with zero hacks.
3) Router metrics (OpenWrt)
OpenWrt node-exporter Lua modules give me Wi-Fi signal, bitrate, and stations. I kept those on a dedicated Router Overview dashboard to avoid noise.
4) Kiosk-style Overview embedded in Homepage
I enabled Grafana anonymous viewer mode and embedded the Homelab Overview via an iframe. That makes the homepage feel like a real NOC wall without needing a login.
🧨 Gotchas (And Fixes That Worked)
- Grafana iframe login loop
- Fix: enable
GF_SECURITY_ALLOW_EMBEDDING, anonymous viewer, and properGF_SERVER_ROOT_URLwithSameSite=None+Securecookies.
- Fix: enable
- cAdvisor couldn’t talk to Docker
- Fix: bump cAdvisor to a newer version that supports the current Docker API.
- Prometheus/Loki permissions
- Fix: set ownership of data directories to the UID used by the container images.
- Router exporter only bound to loopback
- Fix: change the OpenWrt exporter to listen on LAN (not
127.0.0.1).
- Fix: change the OpenWrt exporter to listen on LAN (not
- Homepage bound to LAN only
- Fix: ensure Tailscale Serve proxies to the LAN IP, not localhost.
These are the little operational details that turn dashboards from “demo” into “reliable.”
✅ Results
What I can answer instantly now:
- Are core services responding? (blackbox)
- Which node is hot or memory-bound? (node-exporter)
- Which container is noisy? (cAdvisor)
- What’s spamming logs? (Loki)
That’s the difference between reactive firefighting and proactive ops.
🔜 Next Up
- Add alerting channels (email or chat)
- Optional: add Proxmox export metrics
- Add top slow endpoints for services with APIs
📚 References
- Grafana
- Prometheus
- Loki
- Promtail
- Node Exporter
- cAdvisor
- Blackbox Exporter
- Netdata
- Homepage iFrame widget
🧠 Meta Description
Built a homelab observability stack with Grafana, Prometheus, Loki, and Promtail. This post documents the architecture, dashboards, and real-world fixes needed to make the system reliable.